Hello folks, back from a little vacation. Did I miss anything?
Everyone and his mother was waiting for a sell-off and we finally got one today, but weird that the DC earthquake served as a catalyst for much of the carnage. Immediately after the quake, equities shot up (wtf?) while metals fell (wtf?) even though the dollar also fell (wtf?), and mining stocks were absolutely destroyed (ok, no surprise there). Fair is foul and foul is fair these days. Incidentally, in this late stage of our fraudulent fiat currency regime, it's looking like some serious external shock is needed (along with the bullion bank raids, of course) to cause gold & silver to sell off once they really start picking up steam. The last three times that the metals had an RSI greater than 70, the RSI has stubbornly stayed over 70 until the day of some exogenous event: Fukishima, Osama bin Laden capture, and now the Gaddafi theater/DC earthquake.
OK let's start with the old stand by daily gold chart. We appear to have found support at the top purple dotted line. If we really do bounce off of it, then that might signify a game-changer and a flight to the moon (btw I was surprised to see both Ben Davies and Jim Rickards make a big deal of the Venezuela news). More likely, IMO, the top purple line fails as support, but the next purple trend line doesn't, at the $1725 area. If that too breaks, a drop to the 144-day MA would seem to be in the cards, which might then be in the mid- $1500 range.

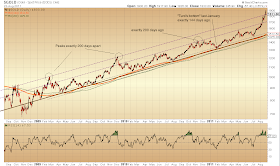
If you recall, in early June, I brought up how the 144-day MA was moving in a straight line (or more precisely, coiling tightly around its regression line), such that, if that pattern were to continue, you could get a very good idea of what's going to happen based on what happened 144-days ago. Interestingly, today's $70 drop is exactly 144 days after the low point of the January 2011correction (of course I refer to trading days).
The 144-day MA (orange) is still tracking the brown regression line, which is good news (because if we assume the rate of ascent will continue its 3-year pattern, the further we are from the regression line, the more imminent the correction). The 200-day MA (green) also moves linearly, and that pattern also hasn't changed yet despite the huge jump in gold's price. Note 200-day intervals are also significant: I've circled two peaks exactly 200 days apart, and the November peak was exactly 200 days ago today.
Here's my updated monthly chart from June 2. Back then it very much looked like a breakout was impending, either up or down. Well, I'm gonna go ahead and call this one for up. Does it not look like we'll hit the purple line by the end of the year? That would be anywhere from $2100 to $2400 depending on how long it takes to get there.

Now silver. If you recall, I've been focusing on the blue trend line connecting the low points since silver's breakout of a year ago. Well, that line now seems to be really significant, as silver has bounced off of it 4 more times since I noted it back in July. If that line is broken, I'd hate to be short.

And here is the old stand by weekly chart. That trend channel looks like a real good one. The 34-week MA also seemed important even before silver bounced off of it in late June. It's now well over 36, so Wynter Benton is probably licking her chops. Or someone's chops, as I hear she is something of a free spirit.

Hey GM,
ReplyDeleteNothing exciting really. Gold ran up a couple of bucks and then got smashed down on options expiration, rumored and expected margin increases and the expectation on Friday Bernanke will do something or nothing. Like Pavlov's dog we respond to the same old play because that is what we know and expect.
The river boat gamblers are expecting more QE tomorrow and if we get it then Gold will go up. If we don't get it then the market will fall and everyone will liquidate whatever is necessary and start looking for safe havens. Bonds not worth a damn. Stocks are terrifying but that's where Benny wants us. Hmmmm, what's left? Cash or ....? take your pick.
I am guessing the Bernanke will give us "we are standing by to do what(ever) is necessary but the crystal ball is still cloudy", "Deflationary pressures are still with us and no sign of inflationary blah, blah", "Rogaine is still not working for me" and "Mrs Bernanke still has me sleeping on the couch" message.
Oh yeah, and one or two dissenters just to make it look like they actually discuss stuff and are not part of a hive mind controlled by Dr. Strangelove.
ReplyDeleteLong bond yields are up big today. Maybe QE3 is in the works? It wouldve been impossible with gold near $2000, but if we fall another $70 tomorrow, I'm gona place my bets accordingly.
ReplyDeleteI have no idea why the 10yr is up. It doesn't make much sense to me.
ReplyDelete"Gold, unlike all other commodities, is a currency...and the major thrust in the demand for gold is not for jewelry. It’s not for anything other than an escape from what is perceived to be a fiat money system, paper money, that seems to be deteriorating. - Alan Greenspan, August 23, 2011"