 |
| S Roche, Tyro Trader |
You may see the family resemblance:
 |
| S Procheimian, This Writer |
Now to work:
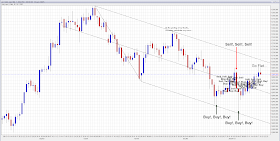
Here is the gold chart in question as it first appeared. It was drawn early Dec, 2012:
and here it is again as notated by Roche in real-time showing his trading decisions:
Some commentary is called for: Roche is an idiot. His claims of kinship will have to be investigated thoroughly. Three good trades saw his trading account rise by over 300% during this December/January period. He gave most of that back by trading the same size regardless of where the price was within the channel. At the extremes the signal is clear and the price adjustment swift (1). Near the median line the market is uncertain, the price signals provide a lot of noise and the intelligent trader will reduce their trade size accordingly (2), if indeed they must trade in the noise band at all rather than wait for the next fat pitch.
If Roche had bothered to read The Hour Between Dog and Wolf he would have known that the exhilaration of his successful trades caused chemical changes in his body that adversely affected his trading ability (3). It was either that or the celebratory excessive drinking whilst trading.
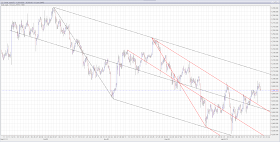
Now, you are looking at the above charts and no doubt thinking this is all well and good but how did Roche, with his obviously short attention span, make these trading decisions in real time? The answer lies in the works of Benoit Mandelbrot explaining the fractal nature of markets. Median Line Analysis, or Andrew's Pitchforks, work as well (4) on all time frames and the channel above is reproducible on the four-hour chart, seemingly providing much greater clarity:
Roche noticed a channel (red) within the channel and produced this next chart in late December:
You will note that during this last week the gold price broke out of the red channel resistance, re-tested it (on the Comex open at 08.20am, then fully fledged selling set in at 08.30 with the release of the better than anticipated Initial Claims report). The price at the red upper channel support was then strongly rejected.
To bring us fully up to date on his week's trading is this final 4 hour spot gold chart with the addition of three more aids to timing: Fibonacci Fans (Orange), Fibonacci Retracements (Blue) and the Relative Strength Index (RSI in lower panel):
In addition to all the above Roche relies on Monthly, Weekly and Daily charts showing Moving Averages of various durations, Relative Strength Index (RSI) on all durations, Market Profile(tm) Analysis provided by Bell Curve Trading, Lance Lewis's Daily Market Summary for gold sentiment indices (presently suicidal) as well as general market commentary and upcoming events, and then of course, there is Roche's successful trader pal who shares tips with him out of a rare and misguided sense of pity.
Apart from all that, Roche is ultimately relying on Malcolm Gladwell's concept of expertise, The 10,000 Hour Rule, in Outliers. Roche is about 6,000 hours into his trading adventure.
This Week's Performance: +32.73%
This Week's Quotes:
(1) "TIME: realize how fast the market moves away from the high or the low" - Paul Tudor Jones
(2) "Traders need to stay within volatility adjusted unit sizes & learn to regulate risk thru time if wealth accumulation is to occur" – PTJ
(3) "My biggest hits have always come after I had a great period and I started to think I knew something" PTJ
(4) "Just when you think you have got the keys to the market they change the locks" Anon Wall St Trader
You can follow S Roche on Twitter @srochetrading. He doesn't Tweet much.
S Procheimian


Post of the millennium!
ReplyDeleteWell played.
Milamber
Superb first post, S Procheimian! Far better than the usual nonsense spouted on here by your distant relative, S Roche... ;-)
ReplyDeleteWelcome to Screwtape - a great addition to the site.
You know, the story of how JdA REALLY came to write for Screwtape is actually a rather interesting one, but I'm contractually unable to tell it... Warren's already edited it out about twenty times, and GM has now put armed guards next to my computer that vet every word in case I give any clues to 'the secret'.
One day I plan to take them by surprise and chloroform them, and then the world will be wiser...
If this is the same Roche who periodically comments on my blog well then, enough said!
ReplyDeleteGreat post S Procheimian
Terrific first post, sir.
ReplyDeleteAnd JdA, you've already used the old "does this napkin smell like chloroform" trick on me once, and I won't fall for it again. There's an old saying in Tennessee — I know it's in Texas, probably in Tennessee — that says, fool me once, shame on — shame on you. Fool me — you can't get fooled again.
Excellent work!
ReplyDeleteJust to explain some of the used terms to those who art not familiar with Technical Analysis.
Andrew's Pitchfork: This is utilised when a TA expert continually talks about candlesticks and cannot perceive the way the market is moving. Andrew sticks his pitchfork into the chart and tells them to choose up or down.
Fibonacci: A method of adding numbers together and lying about the result.
Relative Strength. This is a sign when to steal your cousin's Gold.
Bell Curve: A ringing in the ears when your blood-pressure gets to a point where a heart attack is imminent because of faulty analysis.
Mandelbrot Fractal: This is the term used when you see your investments getting smaller and smaller in ever decreasing circles.
@ S Procheimian:
ReplyDeleteWelcome to the zoo.
I particularly loved your final graph!
So clever, and clear, so the meaning just jumps out at one.
I can see why GM didn't bother with his Sunday Pregame this week, as he could not have come close to your graphical insights and their practical implications!
I now know what I will do tomorrow when the markets open downunder here. Too bad we have to wait until Wednesday for North American opportunities to take advantage of your generosity in making a S Roche's experiences available to the world on this serious and widely-read blog.
SLL
Thank you for the kind words of encouragement, and Duggo for the technical clarifications.
ReplyDeleteSome might wonder at the point of recounting last week's charts and price action rather than look forward and try to anticipate the next week or the next month. The reason for my approach, (and having Roche as a case study is ideal as he makes so many mistakes), is to provide readers with the tools to start to do it for themselves, if they trade, and match any lessons learned here with their own trading style as everyone is different. That, and prediction is hard.
The charts are from Netdania Chartstation and the data is supplied from the Interbank Market, not Comex. This is a slight but important difference as Moving Averages will be out by a few dollars, Fibonacci Fans and Retracement Levels will be slightly different and some times this will create the opposite impression. As to time frames, try them all. From Monthly, Weekly and Daily down to the lowest. It is astonishing how often there is a flurry of trading at the last moment of any given time frame, and the price is pushed to a positive, or negative, point on a chart line. The charts are very often "Painted" this way to achieve the large traders' desired effect.
Anyway, Roche tells me that he intends to take up full time trading at some stage so he is investing a ridiculous amount of time in front of the screens, hence the short term nature of his trading outlook. Others will want to focus on longer term charts.
Good luck to all,
Inside the Fed Bank of NY building is a mega-Kinkos machine printing billions of dollars each day. ($4.77 billion just on Friday which by month’s end should total $85 billion.) These dollars are bombarding stock markets with fresh liquidity feeding bulls against all odds and logic.
ReplyDeleteOur job is to go with this despite misgivings and all manner of poor news.
cheers!
Now we know where JdA lives!
ReplyDeleteMilamber
Two lemurs on the loose were captured early Monday morning after their owner called police.
North Miami Beach police say that around 2 a.m. they received the call about the lemurs who were on the loose around 2049 NE 173rd St.
http://www.local10.com/news/Lemurs-captured-in-North-Miami-Beach/-/1717324/18210036/-/14rdj7z/-/index.html
Miners down big today, stocks and commodities up or flat ... you know what that means.
ReplyDeleteAt any rate that trade hasn;t failed yet - I can't remember the last time bullion didn't fall big the next day. Let's see if tomorrow's an exception. Gold was already down close to $10 since market close, and silver down 1.5%
OG - February 2013 Gold American Options - Last Trade Date Jan 28th
ReplyDeletehttp://www.cmegroup.com/tools-information/calendars/expiration-calendar/
I've been promising Roche I would do a spreadsheet to check correlation over the years. Maybe this weekend...
...and speaking of Great Correlations, The Pre-FOMC Drift:
ReplyDelete"Since the Federal Open Market Committee (FOMC) began announcing its monetary policy decisions in 1994, U.S. stocks have experienced large excess returns in the twenty-four hours preceding these announcements. These abnormal returns account for more than 80 percent of the U.S. equity premium over the past seventeen years."
http://www.newyorkfed.org/research/staff_reports/sr512.html
which, as they conclude, is curious.