
There was a really important event yesterday.
No, not the ambiguous notice sent off by the the clowns at the CME (though anyone with any paranoid ideas why margins were lowered please feel free to share), but rather that the commissioner of the CFTC went onto King World News -- what can fairly be called a precious metals propaganda outlet -- to say explicitly that the silver market is manipulated.
Now, he has said similar things in the past, but by going onto KWN (which, the name notwithstanding, is not a "news" outlet), and speaking so emphatically, he immediately legitimizes the extreme view held by that websites proprietor and most of that websites guests and listeners. He doesn't necessarily have to agree with the view that the entire silver market is a criminal farce (he probably doesn't), but by appearing on the show for an extensive, sympathetic interview, he has granted GATA and the conspiracy theorists a major victory: their view can no longer be sneered at by the Jon "Go" Nadlers and Bob Moriarty's of the world, and moreover, if journalists continue to ignore their accusations, they are now guilty of shameful negligence and dereliction of duty.
Now to the charts. The black line I drew on the daily silver chart (posted a few days ago) continued to be resistance. Until that line is cleared, this silver correction is not over. How many more attempts will it get?

So, I'd be bearish on silver, except the following charts (with slightly different trend channels) suggest that a fall below $31 from here is unlikely.
Note how the red line was effective support at $33, as I predicted last week. Also note how the lowest black line should provide strong support at $31-31.5

$31-31.5 is also strong support on this chart:

On the daily gold chart, I've drawn a thick horizontal line at Jim Sinclair's $1764 level. Yeah, I too find his "angels" corny as hell, but they have predictive power (e.g. last week I said not to expect a big week in gold based on the $1764 level, which did indeed turn out to be resistance, repeatedly). Note also that I have drawn a dotted pink trend line; I predict that will be the new "line of best fit" for the 144-day MA (same slope, just shifted $50 up). Note also how the price of gold hasn't gone significantly below that line for almost a year.

History says: expect the weekly chart to at least touch the center black line (~$1780), before a correction down to the $1650 level (lower black line).

$1650 is also where the lower line of the wedge is on the monthly chart right now:

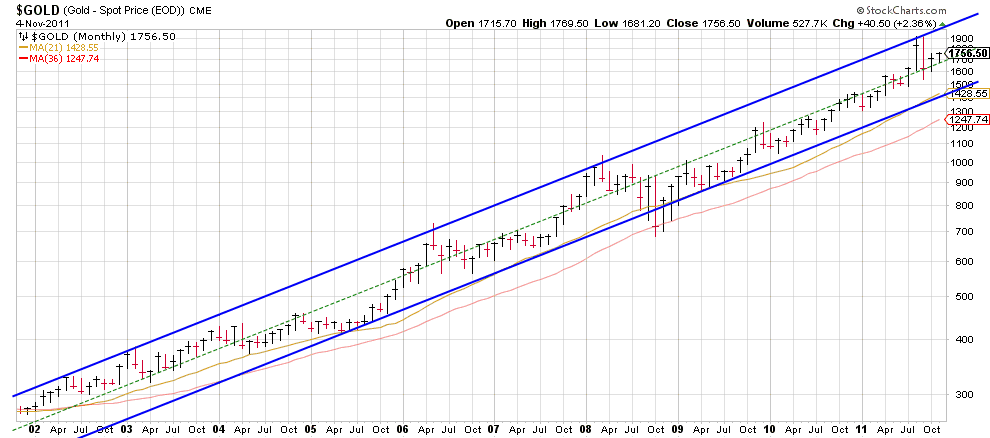
And a different view of the monthly chart. I think we're once again headed to the top of the blue channel.
4 comments:
Hi Gm, I wrote a post about the lowered margins - it's pretty simple why they were lowered, actually: to avoid increased margin calls to higher "initial" margin levels as a result of MF customer accounts being transferred to new clearing dealers.
http://kiddynamitesworld.com/the-cme-margin-notice-that-has-everyone-in-a-tizzy
Ah ok, makes sense. You seem to be the only one who even considered the perfectly logical possibility that a 1:1 ratio meant initiation was being brought down to maintenance ... Not a good sign for PM bloggers. Thanks for the effort you put into this stuff.
good call KD
Martin Armstrong has a new one.
Been traveling all weekend and have not had a chance to read it.
Link Here: http://www.martinarmstrong.org/files/Financial%20Armageddon%2011-04-2011.pdf
Post a Comment