
I am grateful to the collective efforts of FOFOA and Ro' on this one - they knew I had an interest and applied a better approach to researching the topic than I did. Prior to this discovery our earliest bar list was from October 2009. As a quick reminder : we're interested in the GLD bar list because it is the biggest and best data source for public weight lists - it constitutes 80% of the bullion bar information we have in the database (currently over 54 million rows of data).
The key to obtaining the early lists basically boils down to two elements: (1) knowing what the URL was historically and (2) using the popular 'way back web' site to see if the items were stored, then attempting to retrieve them. Here is a quick history of the download URL.
- http://www.streettracksgoldshares.com/inc/BNYBARLIST.xls
This appears to be the very first bar list from 20th November 2004 - it seems the original spreadsheet remained on the website file system for several years, even after the URL changed. Thanks to people writing about the newly opened ETF, the file was indexed. - http://www.streettracksgoldshares.com/inc/Barlist.pdf
This appears to have been the URL the following week (presumably after figuring that a PDF was a better format), and remained for the duration of early 2005 to early 2009. The same file was also available via http://www.streettracksgoldshares.com/us/value/bar_list.php. Although the wayback machine did record the file a few times during this period, some of the files are corrupted (unfortunately). - http://www.spdrgoldshares.com/assets/dynamic/GLD/file/barlist/Barlist.pdf
On 8th October 2009, the bar list header included the first HSBC reference and thanks to Rob Kirby (who wrote about the reduction of size of the list and had the foresight to post the files), we have the files from before and after. The URL is still the same one we use today, and the familiar branding first appeared on 23rd October 2009. Please note that the actual HSBC takeover happened long before that - I'm just showing when the file format changes.

The very first bar list (spreadsheet) appears to have been some kind of float to start things off in November 2004, with 29,954.500 gross gold oz (just under one tonne). 17 of those same bars were still part of the inventory as late as May 2013. During that time they have been removed and added back again (as dark bullion), so who is to say that right now they are gone for good?
Initially I thought having the new lists and the natural churn in bar inventory would give a much bigger boost in 'missing bars' numbers, but the updated graph (below) only shows a modest increase. The new data gives us an additional 8,000 missing bar signatures but given that the records may have had adjustments over the six or seven year period (such as changes to the way the serial number is recorded) it's possible some of these extra items are 'ghost bullion' records (where a historical bar record ceases to re-appear in the data because the signature was changed).
 |
| Adjusted 'Missing Bar Signatures' graph, using early data. Please note: Relatively large limit of reading error applies. |
Now that we've added earlier data, the Dark Bullion charts change as well. Looking back I realized I never published a full view of the Dark Bullion graph for GLD. Here is an updated chart - if you're wondering what Dark Bullion is, please read this. To compare against an old Dark Bullion chart for GLD, please click here. The last time we updated this graph was in July, it's a little bit obscure so I'm happy to discuss it in the comments if anyone is interested.
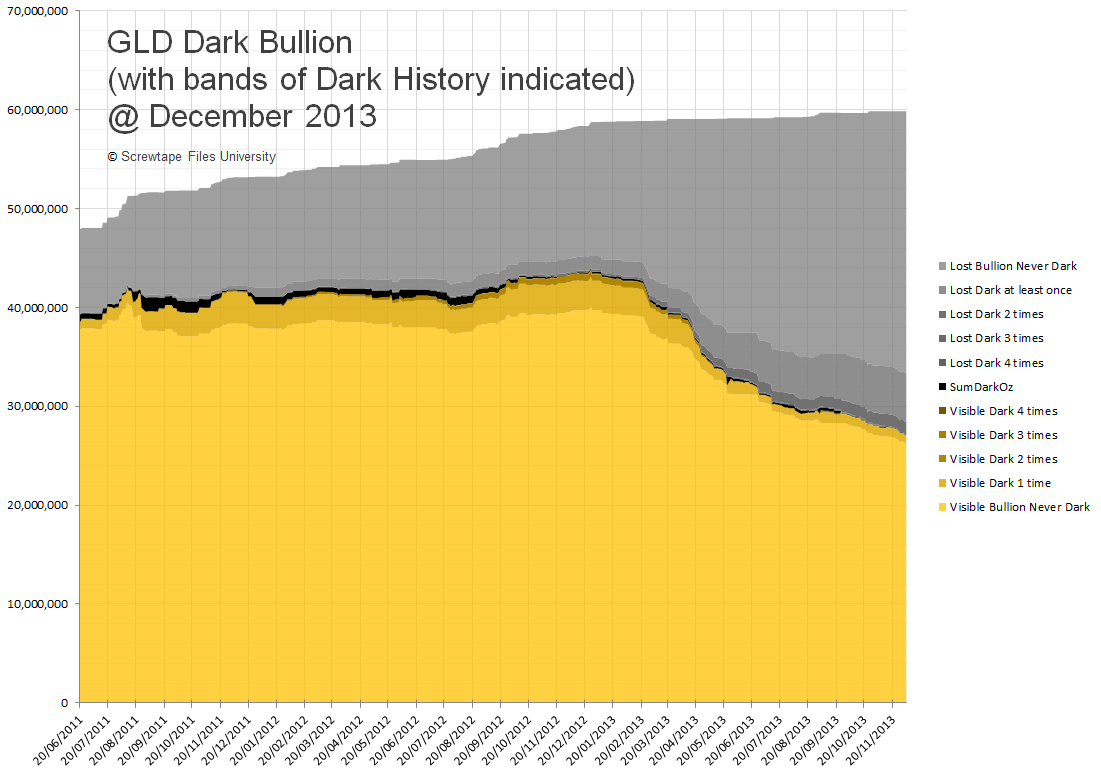 |
| Dark Bullion chart for GLD, updated for December 2013 now includes data from previous years - 2004/2005/2006/2009 |
General appeal - if anyone out there has some 2007 or 2008 GLD bar list files, please consider sending them to me so I can add them to the public archive, and to the data.
Best regards,
Warren James
Brisbane, Australia
20 comments:
Interesting that there is still a bit of dark showing even through the decline.
I suppose we will have to wait for the sell gold crash JPM campaign to run its course before GLD will show any increases and we can see how much of the reduction went to Asia and how much stayed in London.
@Bron, Yes that black line during the decline is from the 'adds' ... i.e. even though the general trend is outflows, they are not only still adding new gold stock but they are also adding new bars previously seen (despite this figure being reasonably low).
It still doesn't look like 'vault stress' to me. Anything grey/dark coloured is stock with the potential to return to the inventory (because it's been dark at least once) ... this range is the best possible candidate for flagging 'bankers gold for arbitrage' but the model breaks down very easily if used in that interpretation (i.e. there are many more patterns to draw before anything can be concluded, unfortunately).
p.s. The new database engine (SQL Server 2014) works really well - it takes less than 40 minutes to crunch these complex comparisons - previously it took about 5 hours to run.
Thanks Warren. Another fine addition to the series.
I'm wondering which part (if any) of the vaulted gold in the bar list data could support the coat check room view. I would have thought that it splits up something like this:
The stash that has never left the vault for years is a long term holding of investors. The bars that leave and never return are sold into the market place. So presumably their combined volumes track the number of GLD shares on issue or the BBs would have to stump up the holding costs. This should be easy to verify. That leaves bars that come and go.
To me these dark bars look like a lending/borrowing operation between the BBs and long-term holders based on the divisibility of the duration of the absences and returns into 30 day increments. I don't have a problem with the idea of the "coat check" gold as an externally borrowed component of the BBs dealings with GLD.
If you look at the historical interest rate on gold loans going back to the 17th century it's around 1.5 per cent per year. I'm looking right now at a printed chart for the one year gold lease rate compared to the "US Dollar Bank Prime Rate" between 1988 and 2005. The current lease rate of 4 per cent (Kitco this morning my time) is right near the top of the range for that period.
During that 17 year period the bank prime rate varied between (approx) 11 per cent and 4 per cent. With depositors and money market funds currently getting close to zero 4 per cent is actually a good deal in comparison.
Something else that is interesting about that 1988-2005 chart is that the gold lease rate spiked in 2000 to 4 per cent and there was another spike into the end of 2001/early 2002 and then the lease rate went into a downward glide path for the next 3 years coming to rest close too zero.
A couple of years back I started to have real doubts about the purpose of GLD - wondering if it was set-up for the precisely the reason the WGC et al claimed. To absorb and oversupply of gold. These lease rate numbers lend weight to this argument.
As you know I have a different view of the GLD + ETP sell-down to a lot of people. I focus on how much physical gold was acquired from this source not on the fact that the shares were dumped. Check out this graph:
http://www.graceland-updates.com/images/stories/13dec/2013dec10etf1.png
h/t Stewart Thomson
I'm hoping to complete some of the unfinished posts I was working on prior to being overwhelmed by other priorities.
Cheers
@Costata welcome back. I fully agree there is room for both coatcheck+arbitrage explanations of the GLD inventory movements.
One of the biggest limitations in tracking it with this data is the information available is such a tiny percent of what's happening out there. The 30-day interval returns and the Dark Bullion flagging are a reliable measurement but in theory we are only able to see it by coincidence - i.e. it is highly likely that there is no specific preference of being 'this is my gold bar' ... i.e. by LBMA rules the bars are always equivalent when it comes to (London Good) Delivery. For the bars which have languished in the vault for many years (our brand new measurement ability), it is possible they just got stuck up the back of the vault.
I too, have some more articles to finish ... my GLD#3 GLD#4 will explore the different time and physical layering, which should give an approximate picture of vault layout as well as increase our tools for detecting gold which is coming back.
As you can see this is still what I'm chasing ;p ... a prediction (from the data) of when the gold will return to the inventory and in theory, a gold price rise with it.
One must also assume that the drain is due for a correction sometime soon. Looking forward to your other explorations on Gold - the US Debt ceiling discussion is coming up next month and it will be interesting to see what is being done.
"The current lease rate of 4 per cent"
you mean 0.4%? I don't see 4% anywhere.
Hi Bron,
Oops!
"gold lease rate spiked in 2000 to 4 per cent and there was another spike into the end of 2001/early 2002"
note that the 1 month lease rate spike to 9.7% and 6% respectively. A lot of volatility and curve inversion.
Hello again Bron,
According to this site (http://www.bankrate.com/rates/interest-rates/wall-street-prime-rate.aspx) the Wall Street Journal prime rate is the most widely accepted benchmark. It's showing the US Dollar prime rate as 3.25 per cent (unchanged from 1 year ago). This prime rate is very low but it's not as out of line with the historical record as the lease rate for gold appears to be.
Can you point to any other period in history where the gold lease rate was this low? If so, it might be interesting to compare that period with this time.
h/t Trader Dan
Looks like Eric Sprott is being put out to pasture because of the losses his investment decisions have caused his companies.
http://online.wsj.com/news/articles/SB10001424052702304202204579252301187881402
"...Sprott's mutual-fund, private-equity and wealth-management arms now collectively manage about $7 billion, down from $10 billion last fall. The vast majority of that decline was from redemptions and position markdowns in the funds and physical-gold trusts..."
"...The poor results come with a personal cost: Mr. Sprott's investment company, Sprott Inc., which he founded in 1981, said last month that it is phasing him out of investment decisions..."
I have data going back to 1989, lease rates have never been this low before, this last decade is unusual both in how low as well as the lower volatility of the rates as well.
1991 to 1994 was a period of low rates, 1m getting down to 0.3% and 12m down to .6%, but a lot more volatility and curve inversion, from 1995 onwards it moved into higher rates. This coincides with a ramp up in the global miner hedge book (ie lots of leasing for selling forward).
Note as well that the hedge book peaked in Q1 1999 was steady until Q1 2002 afterwhich it began declinging, which coincides with the lease rates dropping to their current low rates.
Thanks Bron, I think I have identified where I took another wrong turn. The chart in that book I referred to earlier was discussing interest rates on gold which the author termed a "lease" rate. Prior to 1989 that seems to be the equivalent of a swap or simply a collateralized gold loan.
Unless I'm again misunderstanding these figures it's GOFO that equates to the interest rate on a bank prime rate currency loan. According to the LBMA's website (http://www.lbma.org.uk/pages/index.cfm?page_id=46&title=current_statistics) the 1 year GOFO is 0.13833 - a lot closer to the historical average the author of that book was discussing. I'm guessing that when I go through the data I will find that he was using GOFO not the lease rate in hiis chart.
This LBMA FAQ seems to confirm it: http://www.lbma.org.uk/pages/index.cfm?page_id=52
"What is GOFO?
GOFO stands for Gold Forward Offered Rate. These are rates at which contributors are prepared to lend gold on a swap against US dollars. Quotes are made for 1-, 2-, 3-, 6- and 12-month periods."
Victor the Cleaner has written extensively on this topic attempting to explain it but I have always struggled with it.
Lease rates appear to convey information about traders' appetite for shorting gold and/or the demand for US dollars by gold holders rather than information about the interest rate on a gold loan. So that fits with the gold miner hedging programs in the periods you mentioned.
Cheers
There may well be a different term used in earlier sources.
Gold lease rates are primarily driven by forwards/futures, shorting or collateralised borrowing of dollars, but outright gold borrowing by industry is also a factor.
A link to a paper presented to the 2013 LBMA Precious Metals Conference by Alexandre Gaultier of the Banque de France was tweeted today that had some interesting info in it. I want to record them in these page for future reference.
http://www.lbma.org.uk/assets/Gautier%2020130930.pdf
Apparently in the period before gold leasing was halted under the Washington Agreement the French CB made unsecured loans of gold. This matters because it speaks to the issue of propping up the $IMFS and using paper gold to depress the price of physical gold. Here's the relevant extract:
"The question of (gold) loan restart is pending. Of course, we can see some yields that are attractive, but the point is that the environment is totally different.
In the past, we used to lend some gold totally blank in the market, meaning without collateral and I am not sure it would be acceptable to the risk committee to lend gold for one or more years without collateral. This is the reason the issue is still pending."
In the same paper Gaultier said:
"Our bars are not all LGD, but we have an ongoing improvement
programme."
The French Treasury/CB has around 2,500 m/t of gold. Some of these non-LGD bars could be coin melt (around 90% purity) sourced from the USA in the period prior to the closing of the gold window in 1971. Some of the bars could be damaged or unacceptable under the LGD rules.
Conversion to kilo bars for Asia and this kind of upgrade program could account for the high volume of refinery activity in some of the major centres like Switzerland. In turn this may indicate a desire on the part of CBs and other gold market participants for liquidity.
Thanks for persisting with this Bron. As I said I struggle with these topics. Based on all of the potential strategies that could be used to structure a gold loan these official published rates may convey inaccurate information.
A BB could, for example, write a loan at GOFO but load in an upfront "loan-origination" fee and other charges that de facto increase the interest rate. Long story short, this aspect of the gold market appears to be just as opaque as other areas we have attempted to shed light upon.
Quoted GOFO and GLR should be inter bank. Actual GOFO and GLR paid by a counterparty will be different as it will have a risk premium etc included, but those actual rates are not report to my knowledge.
I doubt the French would be getting it turned into kilobars, that would cost premium and add no extra liquidity from a lendability point of view I'd think.
Re coin melt and other quality issues, this has been an issue for a number of years http://www.lbma.org.uk/assets/lbma_deepstoragebars2006.pdf and http://www.lbma.org.uk/assets/lbma_gd_goldbars_status2007.pdf
Hi Bron,
I don't think the French are turning any of their gold into kilo bars but I imagine remelting for that purpose would account for some of the volume going through major refining centres like Switzerland.
TY for the links on the quality issues. "Quoted GOFO and GLR should be inter bank." This statement is supported in a couple of papers I found this afternoon.
@STF
Better to hide in the dark, fearful of one's vast ignorance, than attempt to enhance one's understanding in public?
Did it feel good to press that 'delete' button? No? I bet it felt like a weasly, cowardly act.
You have nothing but my pity.
@Gary, the pages (page 1, page 2 and page 3) still exist and will be kept for the permanent record .. only the promoted link from our own top left has been removed. If you want to write your own blog, you are welcome to link to them.
The link to 'Freegold Debate' link has been moved to the 'about us' page. I too, am sorry that the discussion format failed. Oh well.
For anyone keeping track, the recent GLD add from last Friday was comprised 100% of dark bullion. i.e. all the gold added was at some time past, in he inventory. So that is 436 bars that did not (apparently) travel east, and presumably didn't travel out of the vault either. Cheers & happy new year all.
Post a Comment