*Update: Please be sure to see victor_the_cleaner's arguments in the comments as to why he thinks the euro zone is unlikely to fall apart. Discussion welcomed.
Happy Thanksgiving, everybody. While my family was stuffing themselves with turkey, I was busy poring over these charts, and this is what I came up with.
I'm bullish on the metals this week, which I guess puts me in a minority of one. In fact, if silver doesn't jump overnight, I will buy some out of the money call options on SLV tomorrow. Yes, I agree, this chart looks bad (and recall the falling wedge I also drew on this same chart last week which suggested a fall to $26):

But, look at this YTD chart with daily closing points only:

Then, one of my long term charts also indicates we're at strong support:

The $SILVER:$USD chart is also about at major support:
 While the $US10Y:$SILVER chart (a proxy for the worth of a coupon payment in silver) looks like it will make one quick move to the top of the purple channel before a rally, or else, follow the new dotted channel down this week.
On the weekly gold chart (first chart below), I suppose a fall to $1630 may be in the cards, although it might be the case that (on a closing basis) the lower black trend line has shifted up $50, which would be similar to how the 144 day MA on the daily chart appears to have shifted up by that amount (see how the purple dotted line on second chart below has been strong support since January):


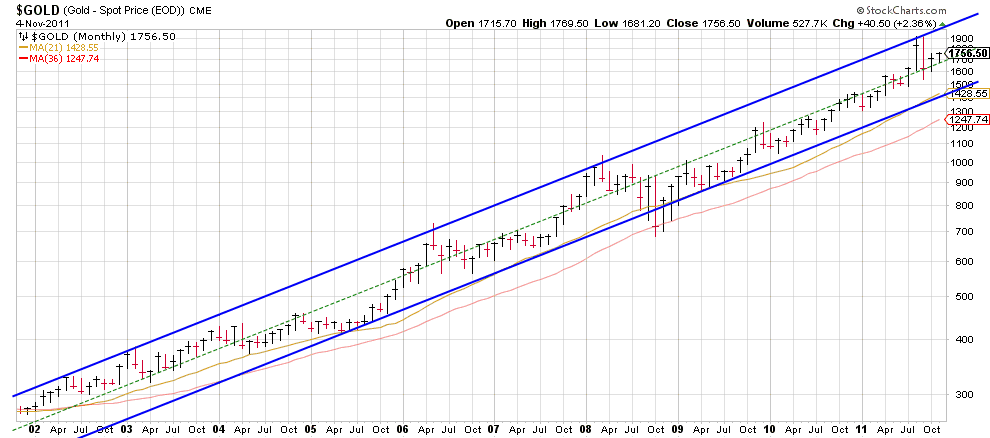
Monthly gold looks to me like we're at strong support to close out November, ready for a breakout to the purple line in the months ahead:

And the $GOLD:$USD chart looks about ready for a rally, which one would think would come more from gold strength than dollar weakness:

I think how you play the metals here (or whether you play them at all) really comes down to your risk appetite. A catastrophe (e.g. out of Europe) seems at least an order of magnitude more likely than even in the recent past, in which case, in the short term, the metals might plummet. But I think the probability on an absolute level is much smaller than is being screamed from the rooftops. And barring a cataclysm, I don't think the metals can be pushed down much further. Let's see if I'm right.